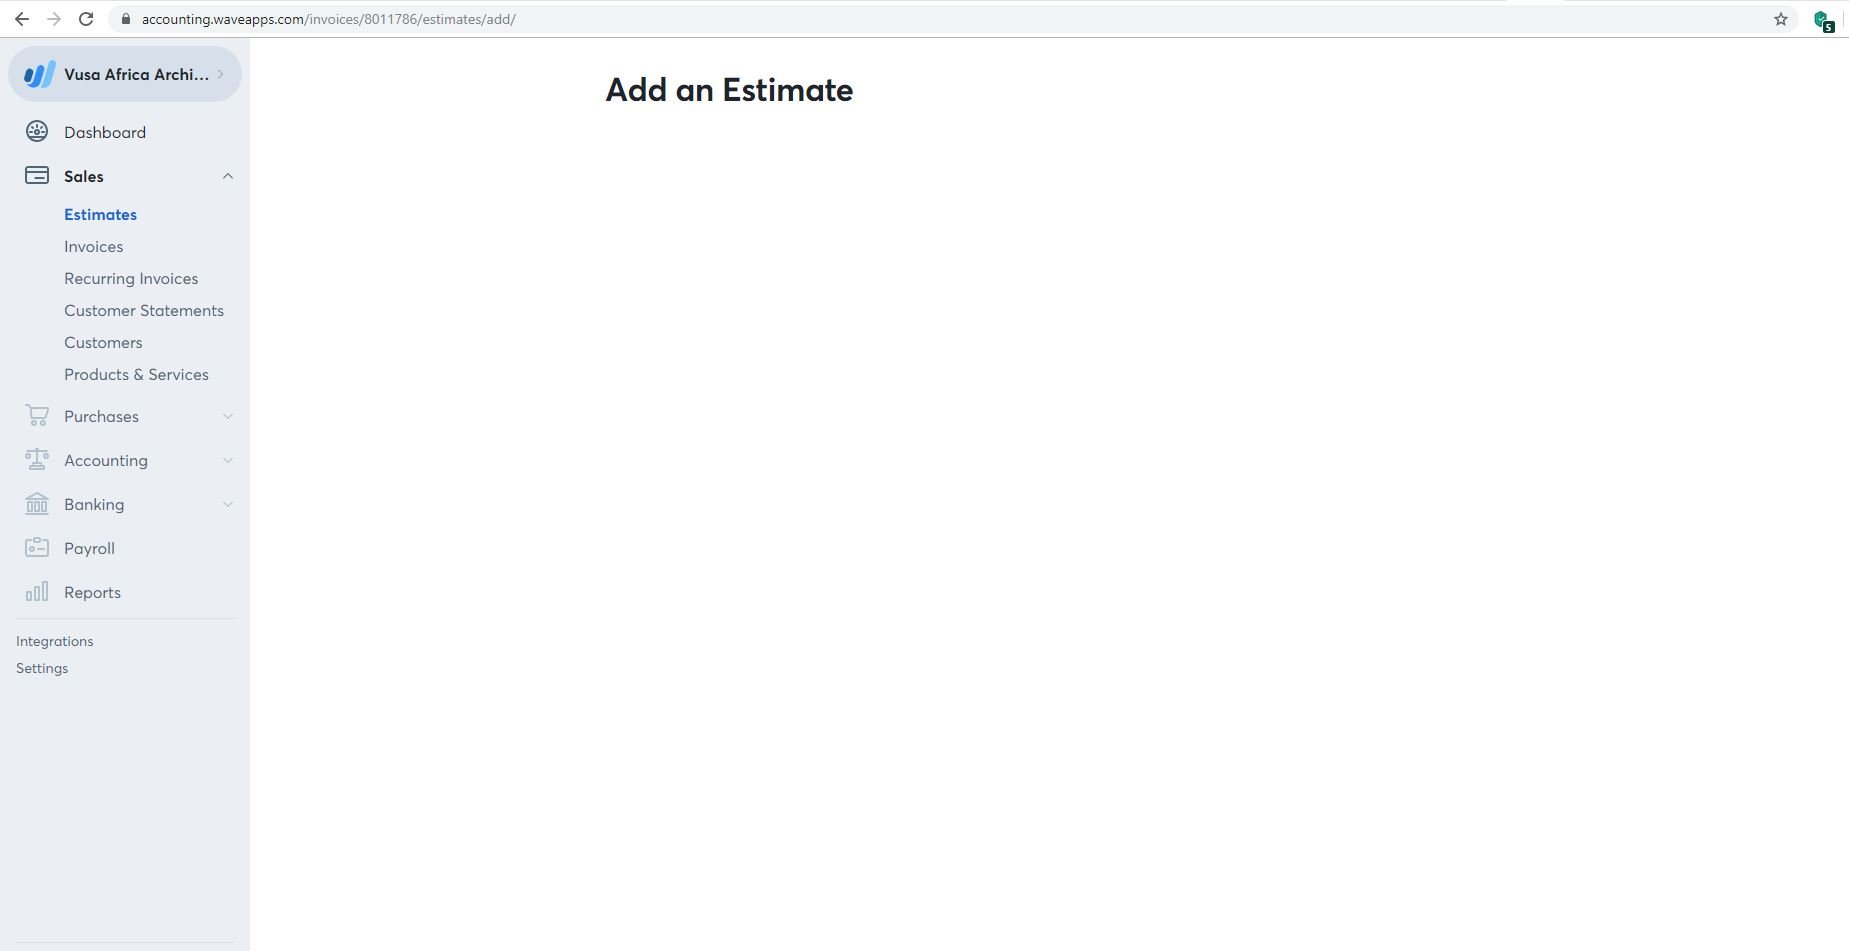
Estimate window not working
I am using web version, recently I reinstalled google crome after that from wave estimate window not working shown blank. When I open wave showing guest collaborator need permission from wave, pls help.
0
I am using web version, recently I reinstalled google crome after that from wave estimate window not working shown blank. When I open wave showing guest collaborator need permission from wave, pls help.
Comments
Hi @smartlife ! I'd recommend clearing your cache and cookies as a first step, and then logging back into your account. If this issue has persisted, could you share a screenshot with us (with personal details obfuscated)?
Hi
I already removed all caches and cookies , no changes. It is working properly in the mobile.
Hey @smartlife, thanks for the screenshot - that'll help us investigate this further. You mentioned in your first post "guest collaborator need permission from wave", do you mean you're a guest collaborator on this account? If so, do you happen to know what type of collaborator access you have?
Same email and password not working estimate window from the computer chrome as well as edge.
Permission only for mobile access?
Before it is working poerly both system same user name and password. I don't know the reason.
Hey @smartlife. I have sent you a support ticket regarding your specific case -- it sounds like we may need to do a bit of further troubleshooting here to find out exactly what's going on.
Good day

I kindly request assistance with the "
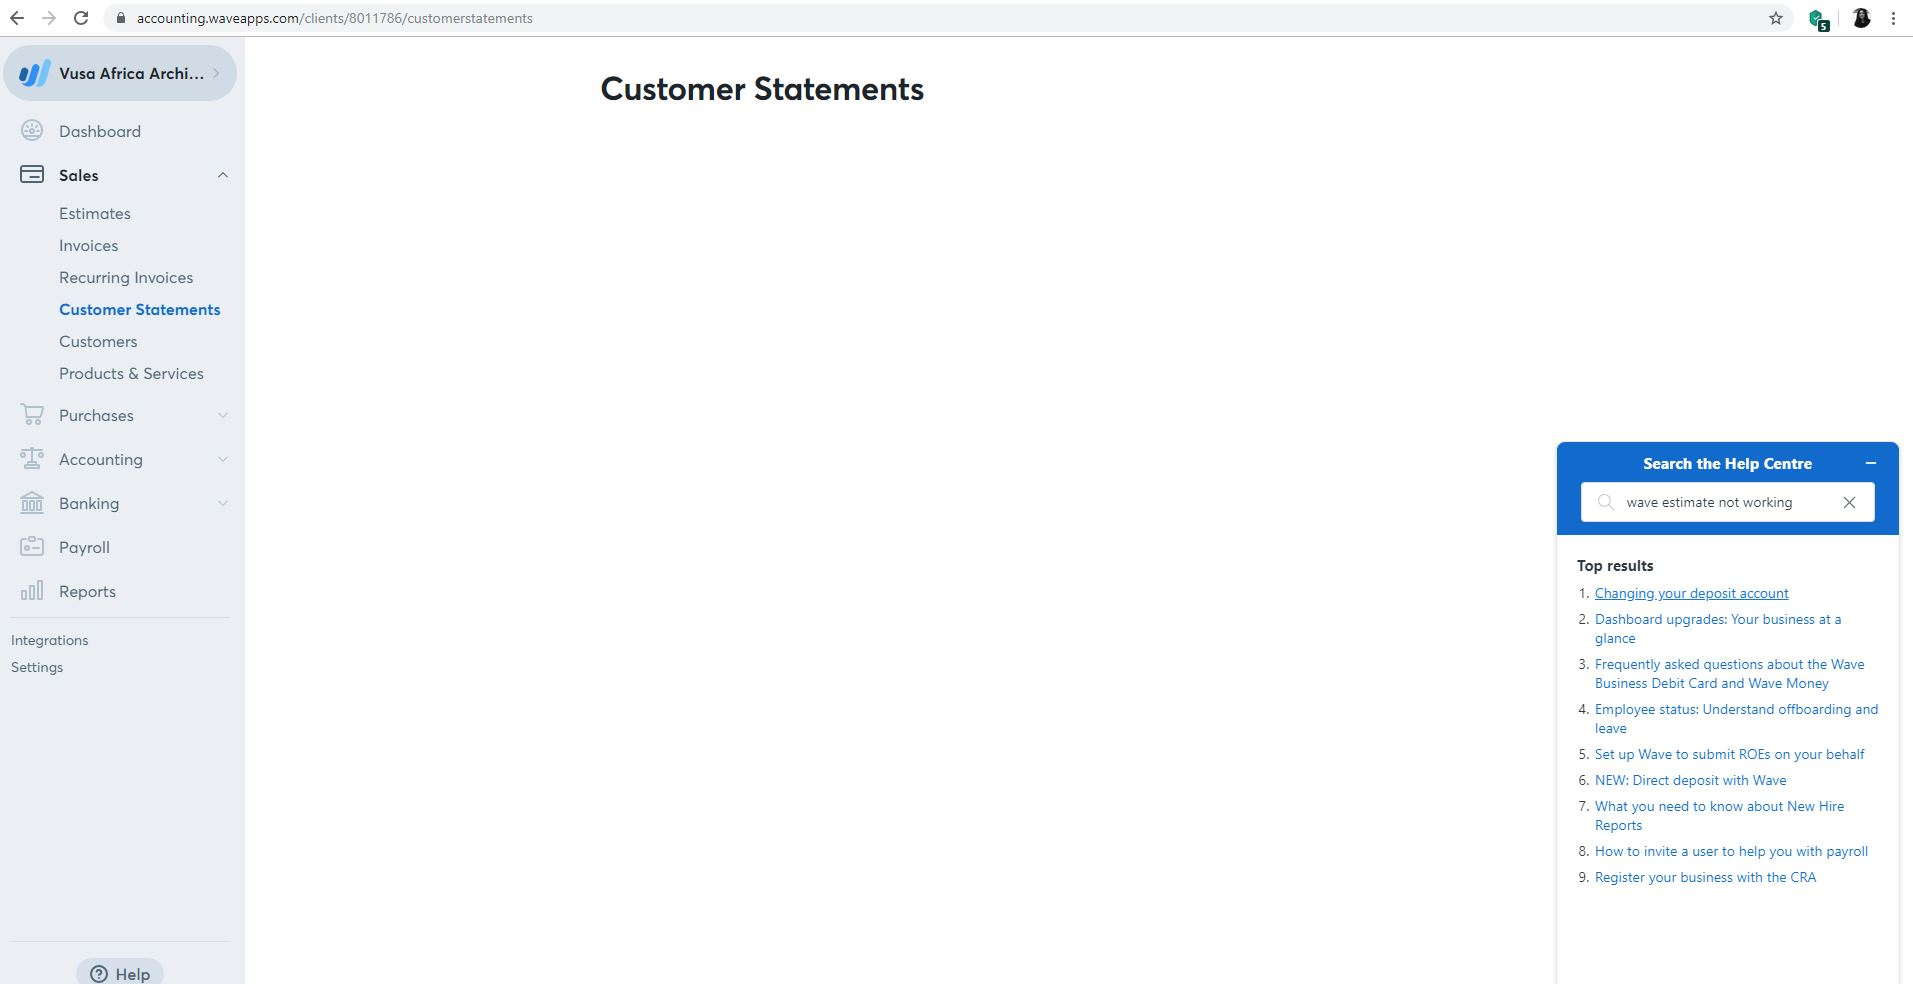
Estimates" and "Customer Statements" tabs which do not show anything except the bold title at the top of the page.
I am having the exact same problem, I have just started using Waveapps and thought I was doing something wrong. A lot of our services begin on estimates so this is an awkward issue.
Hey @VusaAfrica2017Sine and @Donzi thanks for letting us know about the issue that you seem to be facing. There are no current issues that are effecting all users in this way, which leads me to believe that this could be a local issue with your browsers. Are you able to try opening an incognito window in Chrome and seeing if the behaviour persists? If it does, can you try clearing your cache and cookies and see if that makes any difference?
If after doing both of these steps the issue continues, it might be handy to get a screenshot of the entire window (including the URL bar and your Developer Tools). Developer Tools help us to understand issues using the information that your browser collects when you are on the internet. You can open your developer tools using the steps below.
Google Chrome
Select the Chrome Menu at the top-right of your browser window, then select Tools > Developer Tools and click on the Console tab.
Firefox
From the menu: select "Browser Console" from the Web Developer submenu in the Firefox Menu (or Tools menu if you display the menu bar or are on OS X)
From the keyboard: press Ctrl+Shift+J (Windows) or Cmd+Shift+J (Mac).
Safari
To open the “Console” panel in Safari’s Web Inspector press Cmd+Opt+C
Note: In order to view the console in Safari, you have to enable the “Show Develop menu in menu bar” setting in the “Advanced” pane of Safari’s preferences.
Internet Explorer
Press F12 on the keyboard then click on the “Console” tab